Polar Equation for a Straight Line
In Cartesian coordinates, a straight line equation is $y=mx+b$ where is $m$ is a numerical slope and $b$ is a numerical $y$ intercept. Following our rules for converting to polar coordinates, we let $x=r\cdot cos\theta$ and $y=r\cdot sin\theta$. Solve for $r$. $$\left\{ r=\frac{-b}{m\;\cos\left(\theta\right)-\sin\left(\theta\right)}\right\}$$
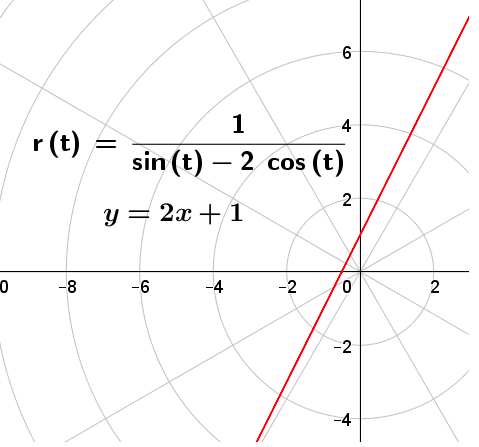
Figure 1 shows the polar plot of a straight line, including especially its polar equation. Most computer graphing software has a special polar mode which accepts polar equations $f(r,\theta)$ and makes a graph like the one shown in the figure. However, that is not necessary in order to make a polar plot and the figure actually is a demonstration of that fact! Geogebra does not have a special polar mode. Instead, the user must know the transformations from Cartesian to polar. What exists and is shown in figure 1 is nothing more than a polar grid which has been superimposed on a Cartesian xy plane. The function for r(t) that is shown on the graph is not actually what is plotted. Instead, the graphed equations are $$\left\{ \begin{array}{c} x(t)=r(t)\cdot cos(t)\\ \\ y(t)=r(t)\cdot sin(t) \end{array}\right\} =\left\{ \begin{array}{c} x={\displaystyle \frac{1}{sin(t)-2\,cos(t)}cos(t)}\\ \\ y={\displaystyle \frac{1}{sin(t)-2\,cos(t)}sin(t)} \end{array}\right\} \;0\le t\le2\pi$$ Since the graph has Cartesian axes, we can also graph $y=2x+1$ on the same plane and observe that they represent the same line. Other software just hides the conversion when r(t) is graphed. None of this suggests that we couldn't graph on circular paper with an angle and a distance. We are merely observing that it isn't normally done that way.